Master the methodology for calculating Share of AI Voice (SOAV) to benchmark brand visibility against competitors within generative AI responses and LLM citations.
12 min read
Foundations
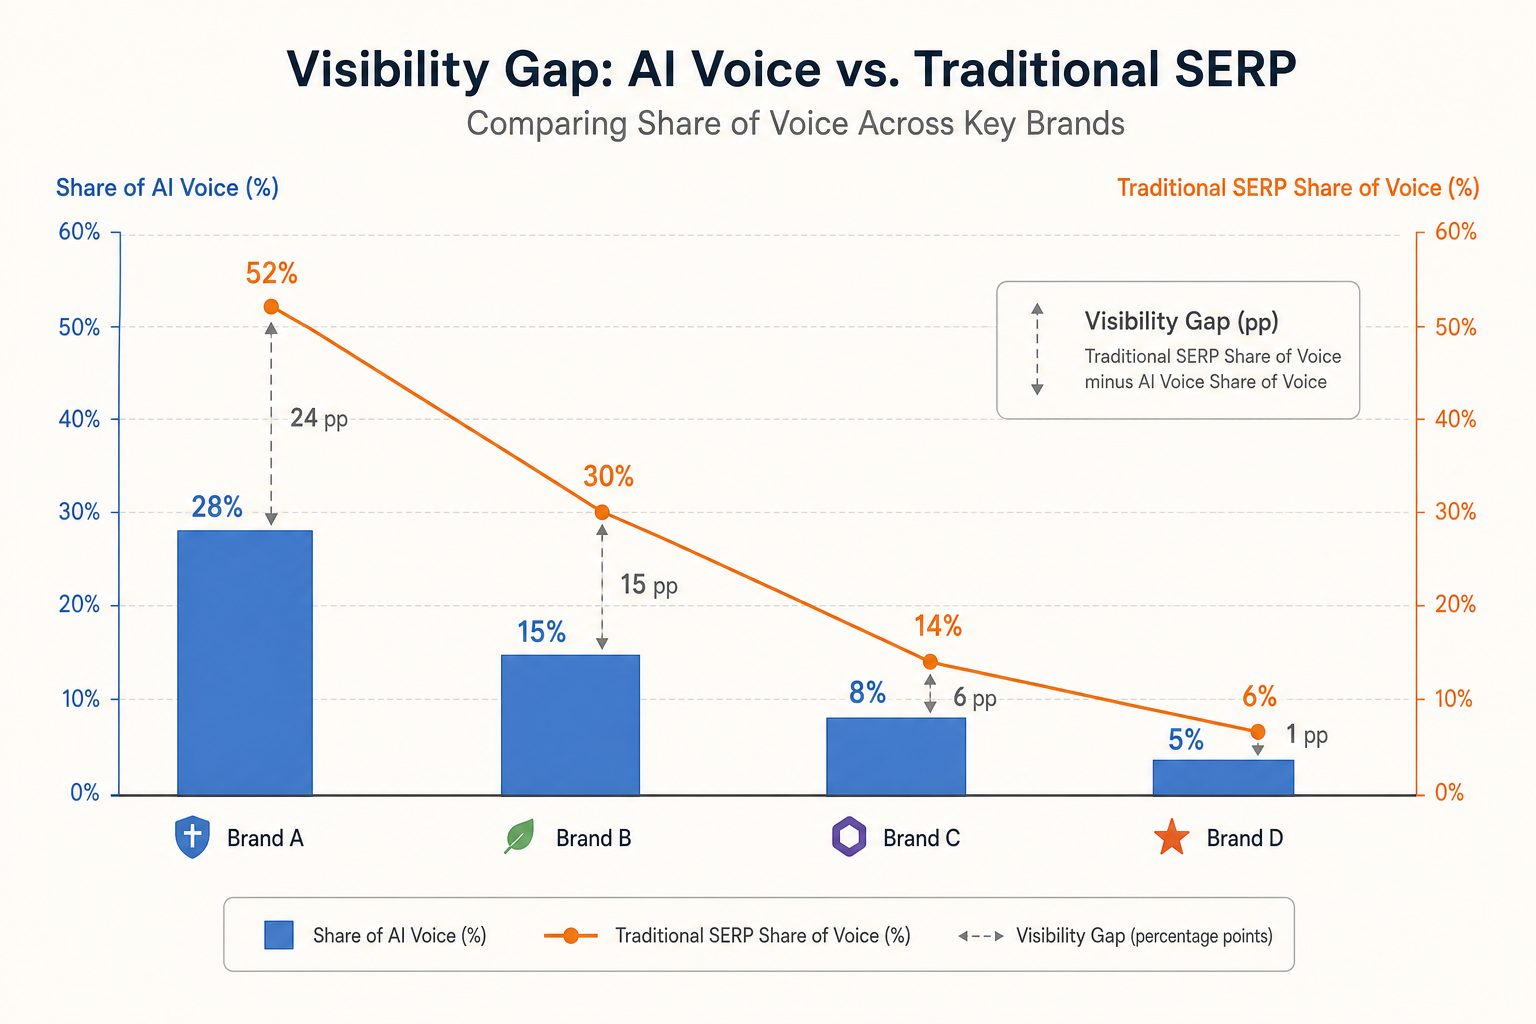
Visual diagram
A bar chart showing 'Share of AI Voice' percentages for four competing brands, with a secondary line graph overlaying their traditional SERP Share of Voice to highlight the 'Visibility Gap'.
Section 1 of 9
Introduction to Share of AI Voice (SOAV)
In traditional search engine optimisation, we have long relied on Share of Voice (SOV) based on keyword rankings and estimated click-through rates. However, as generative search engines like Google Gemini, Search Generative Experience (SGE/AI Overviews), and Perplexity gain traction, the metric must evolve. Share of AI Voice (SOAV) measures the frequency and prominence with which a brand (or a competitor) is cited across a statistically significant set of industry-relevant prompts.
Unlike traditional search, where a rank of #1 is the primary goal, AI visibility is binary: you are either cited as a source or you are not. SOAV allows practitioners to quantify their digital footprint within the 'latent space' of Large Language Models (LLMs) and provide clients with a concrete benchmark of their authority relative to their peers.
Introduction to Share of AI Voice (SOAV)
Lesson Quiz
Pass at 70%.
1. What does SOAV stand for in the context of AI Visibility?
2. How is a brand's citation usually represented in a generative AI response?
3. Why should you use 50-200 prompts instead of just 5 for SOAV tracking?
4. What is an 'Inertia Source' in SOAV analysis?
5. If your brand is cited in 20 prompts out of a 100-prompt set, what is your SOAV?
6. What does a 'Visibility Gap' indicate?
7. Which of these is a 'Middle of Funnel' commercial prompt?
8. What is 'Citation Intensity'?
9. Why might a brand with high SEO rankings have a low SOAV?
10. What is the first step in a SOAV practice implementation?