Master the art of synthesising AI-driven metrics and traditional SEO data into a cohesive dashboard that demonstrates tangible value to stakeholders and clients.
12 min read
Foundations
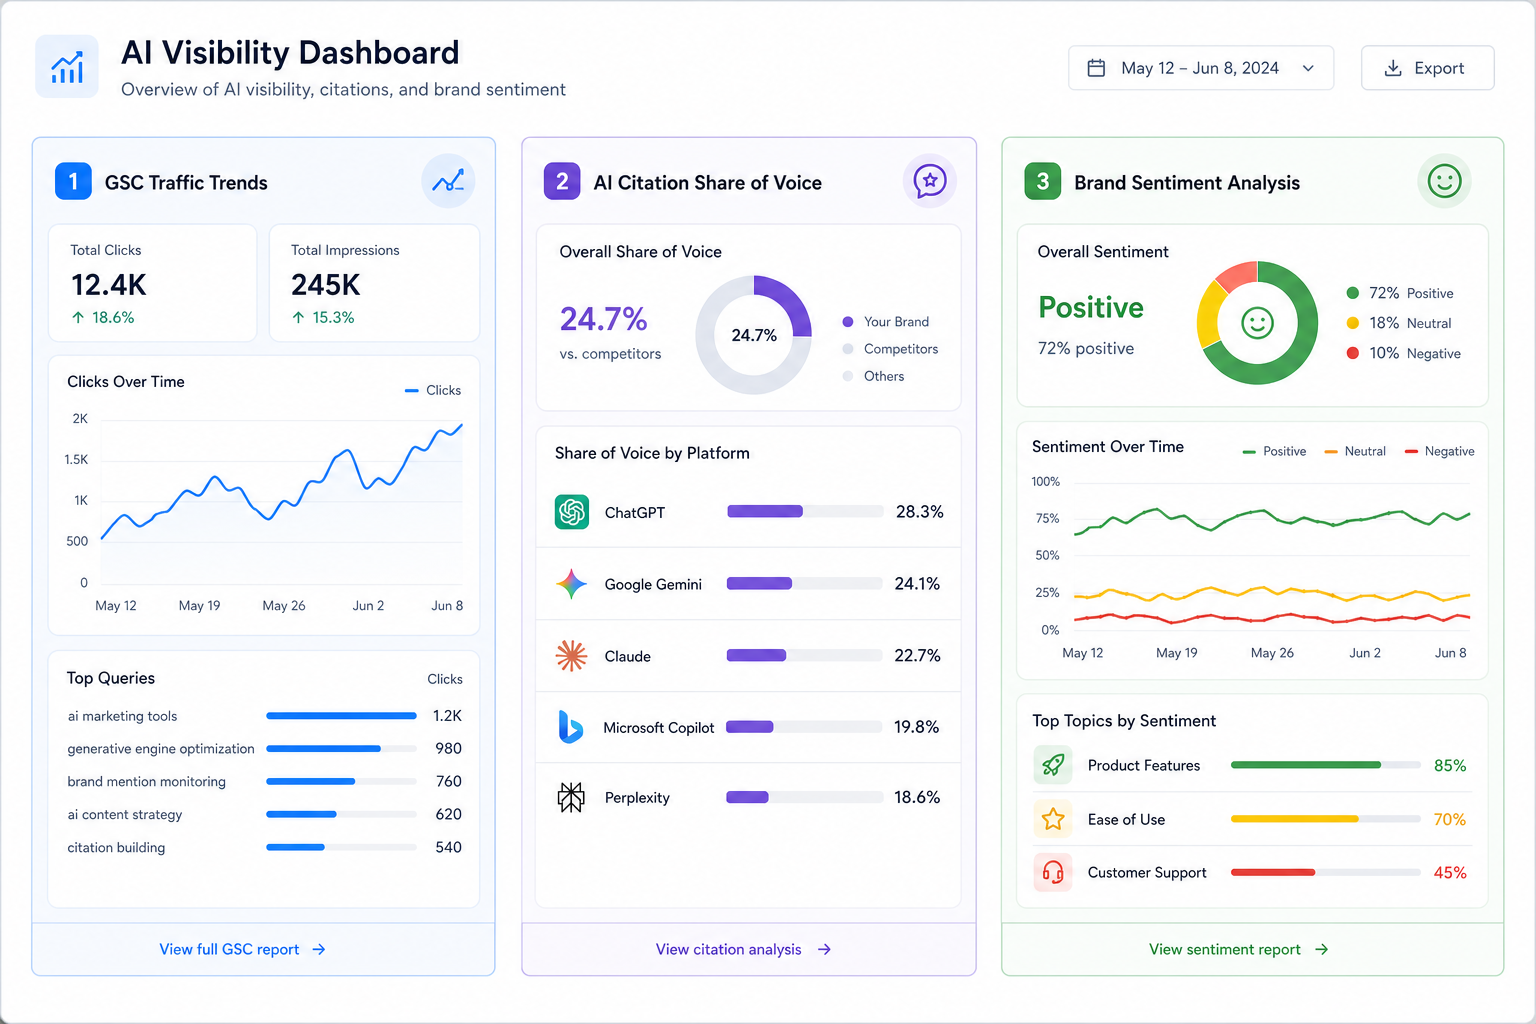
Visual diagram
A dashboard mockup showing a three-column layout: Left column for GSC traffic trends, Middle for AI Citation Share of Voice by platform, and Right for Brand Sentiment analysis.
Section 1 of 10
Introduction to AI Visibility Measurement
In the era of Answer Engine Optimisation (AEO) and Generative Experience Optimisation (GEO), traditional rank tracking is no longer sufficient. Clients need to see how their brand appears in ChatGPT's Search, Google Search Generative Experience (SGE), Perplexity, and Claude. A visibility dashboard acts as the bridge between technical execution and business value. This lesson covers how to architect a dashboard that moves beyond simple 'rankings' to measure influence, sentiment, and share of voice across the AI landscape.
Introduction to AI Visibility Measurement
Lesson Quiz
Pass at 70%.
1. What is the primary purpose of a visibility dashboard in the AI era?
2. What does 'gSoV' stand for in this context?
3. Why should you categorise keywords into clusters for AI reporting?
4. Which tool is cited as the industry standard for accessibility in visualising SEO data?
5. In an AI response, what is considered the 'new Page 1'?
6. What is 'Dashboard Bloat'?
7. How can sentiment tracking benefit a brand?
8. What is a recommended 'Middleware' for data normalisation?
9. If traditional clicks decrease but brand search volume increases, what might this indicate?
10. What does the 80/20 rule refer to in dashboard design?