Master the essential metrics for tracking performance on AI surfaces, focusing on Brand Mentions, Reference Share, Sentiment, and Citation Accuracy to quantify AI visibility.
12 min read
Foundations
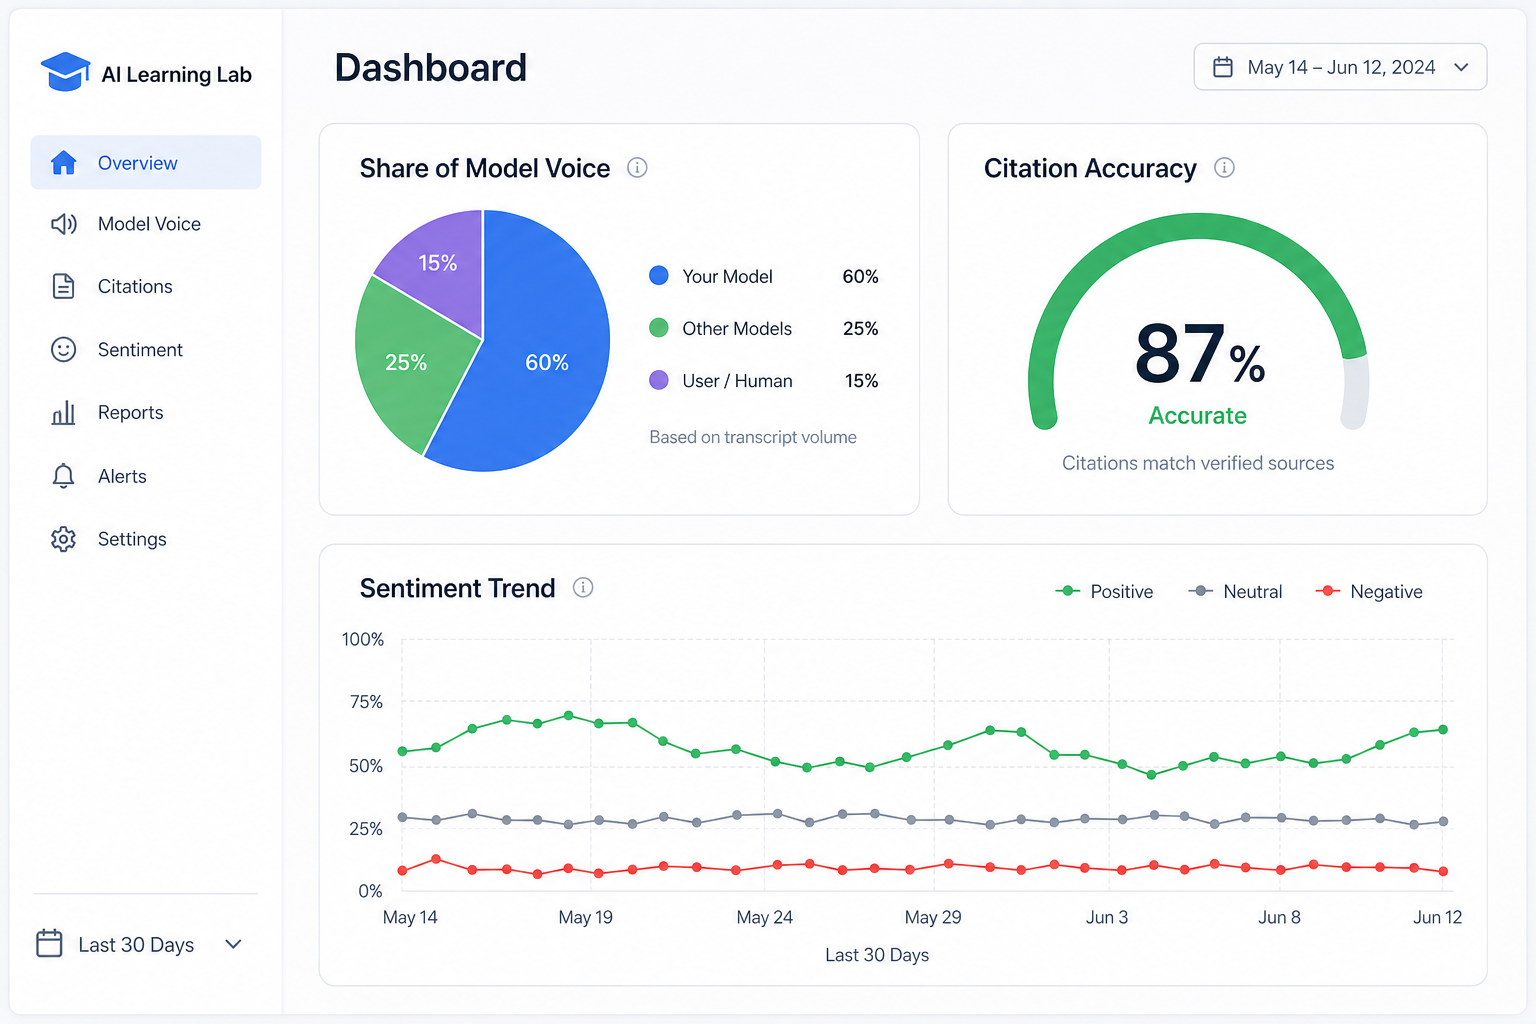
Visual diagram
A dashboard mockup showing 'Share of Model Voice' as a pie chart, 'Citation Accuracy' as a percentage gauge, and a 'Sentiment Trend' line graph over 30 days.
Section 1 of 11
Introduction to AI Visibility Metrics
In traditional SEO, we rely on rankings, impressions, and clicks. However, AI surfaces—such as Google Search Generative Experience (SGE), Perplexity, and OpenAI Search—operate on a different logic. Success is no longer about being 'Result Number One' on a list; it is about being the primary reference in a generative response. To measure this effectively, practitioners must pivot from traditional SERP tracking to AI-specific metrics that account for synthesis, attribution, and user trust. This lesson identifies the core metrics that define success in the age of generative engines.
Introduction to AI Visibility Metrics
Lesson Quiz
Pass at 70%.
1. What does 'Share of Model Voice' (SoMV) measure?
2. Which metric helps identify if an AI is using your content as 'general knowledge' without a link?
3. Why is 'Information Gain' important for AI visibility?
4. What is a 'Primary Citation' in the context of an AI response?
5. How should a 'Critical' sentiment in an AI response be handled?
6. What does a high Prompt-to-Purchase (P3) score indicate?
7. Which of these is the most effective way to fix an AI hallucinating your product's price?
8. What is 'Attribution Tone'?
9. If your SoMV is high but your traffic is low, what might be the issue?
10. What is the recommended sample size for a manual SoMV audit?